By: Thom Albrecht – Chief Revenue Officer at Reliance Partners
For small and mid-sized motor carriers, especially those with a fair amount of dependence
upon freight brokers and the overall spot market, the trucking recession is now four years
old, having begun in February 2022. Larger carriers, especially enterprise carriers (defined as
those with 3 or more solutions to shippers (examples: OTR, dedicated, intermodal,
brokerage, final mile, etc.), generally didn’t feel the trucking downturn until late summer 2022
or even post Labor Day.
The recovery was only about 2 years, so a 3.5 to 4 year downturn is not only significant, but it
far outpaces previous cycle downturns. On average, the last 4 downturns were about 20%
longer than the previous recoveries.
Have Any Important Freight Metrics Actually Improved?
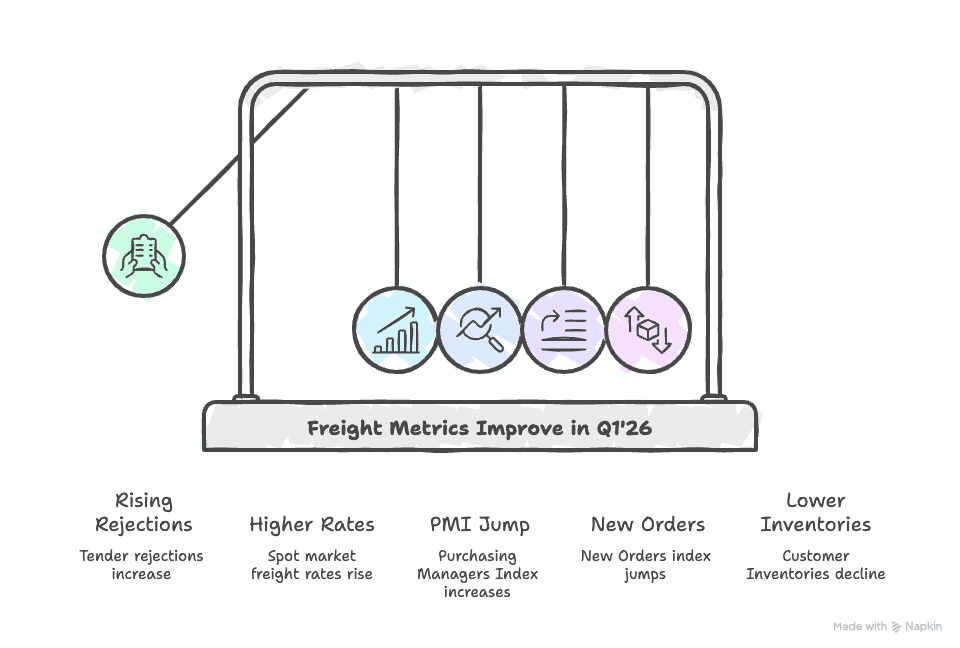
Freight vital signs began to percolate in late November and continued to advance in Q1’26,
most prominently captured in rising first load tender rejection rates and an increase in spot
market freight rates. Depending upon which source one examines, tender rejections have
risen from about 5% to approximately 13% to 14%, while average spot rates are up over 20%,
with many lanes up significantly more.
Adding to the optimism was the Purchasing Managers report, released by ISM on February 3.
The PMI and its 10 sub-indices are momentum measures, with figures above 50.0
representing growth of various elements of manufacturing, while below 50.0 represents
manufacturing contraction. PMI’s 10 sub-indices are categories like exports, imports,
inventories, backlog, production, labor, etc. The PMI index jumped to 52.6 from 47.9, only
the second month above 50.0 in the last 50 months. [Note: not a typo!]
More pertinent to trucking was the nearly 10-point jump in New Orders (from 47.4 in
December to 57.1) and the continued decline in the Customer Inventories (CI) figure
(declined from 43.3 to 38.7). Both are indications of future trucking volumes. On New Orders,
the higher the better for future freight and with Customer Inventories, the lower the number
the better for trucking as this suggests that companies don’t have enough inventories,
meaning additional replenishment orders and truck shipments. The all-time low for CI was
25.0 in July 2021, when trucking was booming. Conversely, CI has been hovering between 45
to 50 for the better part of two years, so a drop below 40 is noteworthy
If 2026 Finally Has a Recovery, Will it be a Demand and a Supply Recovery in
Trucking? Or Just One of Those Two Elements?
Let’s start with a demand discussion. Critical factors impacting demand remain mediocre—if
not pressured. We break it down around 3 influences: a) The health of the consumer, b)
Business confidence, which drives capital spending and industrial production, and c)
Housing trends.
3 Big Buckets Impact Trucking Volumes—How Does 2026 Look?
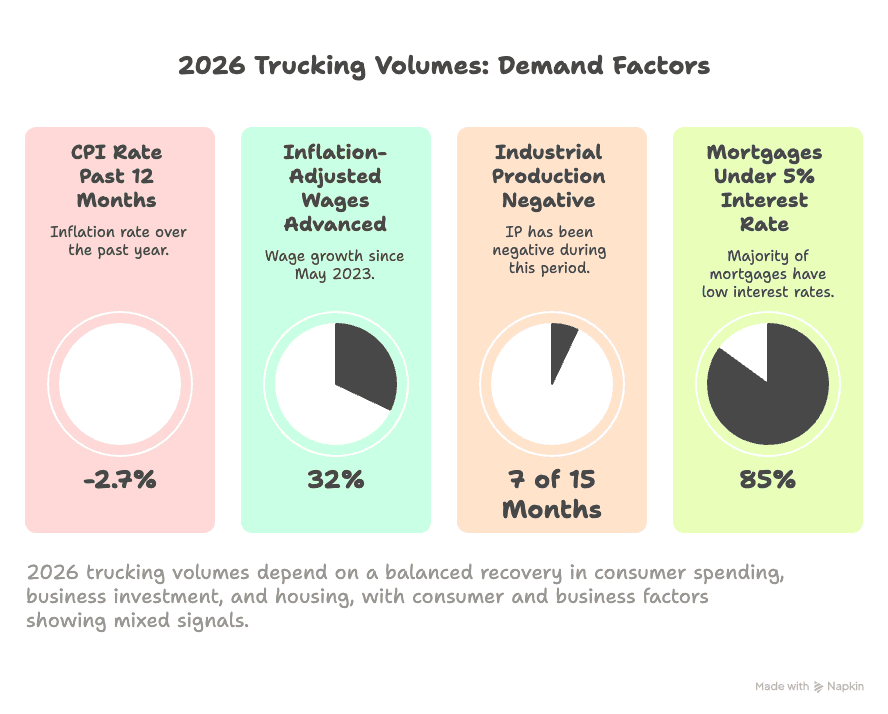
1) The Consumer: For 28 consecutive months from 2021 into mid-2023, inflation-adjusted
wages trailed inflation, meaning month after month consumers lost purchasing power.
Fortunately, since May 2023, inflation-adjusted wages have advanced 32 consecutive
months. However, when consumers lose purchasing power, it can often take twice as
long to regain their purchasing power. And many items, some in the CPI (consumer
price index) and some not reflected in the monthly CPI report have risen significantly
more than the 2.7% CPI rate of the past 12 months. This includes items bought on a
regular basis such as food and beverages, various consumer products, diapers,
coffee, pet food, deodorant and other periodic purchases like car and home owners’
insurance, tax preparation, materials for home repairs, furniture, etc.
Thus, while the consumer is experiencing a recovery in lost purchasing power, it may be midto-
late 2027 before the consumer is described as all the way back and “flush with cash”.
2) Business Spending: This is where it gets interesting. In late 2024 and into February of
2025, various corporate indicators were rising, from public company commentary on
earnings calls, the ISM (PMI, New Orders, etc.), surveys about corporate capital
spending, expectations of tax cuts and a return to full bonus depreciation and then…it
all ground to a halt once the tariffs went from a campaign phrase to actual policy. This
started around February 19, was accentuated by “Liberation Day” on April 2, 2025 and
ended up being a drag on corporate decision-making most of 2025.
Just like the stock market hates uncertainties, business decision-makers do not like it when
regulations and policies are in limbo. Between the initial tariff shocks, volatile negotiating
tactics and fluctuating tariff rates and at times an approach that seemed more reactionary
than strategic, corporations slowed their capital spending plans, which had an enormous
impact upon freight creation, i.e., trucking volumes. Plans were paused or shuttered
regarding plant openings and expansions, investments in technology, machines, new offices
and hiring, etc., and this resulted in weak corporate capital spending.
One byproduct was that industrial production (the single biggest determinant whether it’s a
special freight year or an average one or a poor one) never established any momentum.
Indeed, during 7 of the last 15 months IP has been negative. IP is not falling apart, but it’s
been basically running along at mostly a replenishment need for corporations and not
signaling an expansion mode.
The optimism in the January ISM/PMI report is intriguing because it suggests that business
confidence may be increasing. Even if corporations don’t necessarily like where tariffs ended
up, if the shock is over and the rules of engagement are known and stable, then that may be
enough to unfreeze corporate capital spending decisions that had become semi-paralyzed.
Combine that with the low inventories we described previously, and enhanced business
incentives tied to the OBBBA (Trump tax cuts), it is not unreasonable to think that IP and
hence, freight will have at least a modest uptick in 2026.
3) Housing:There are two components to housing, existing home sales (EHS) and new
homes, aka, housing starts or new construction (NC). EHS in 2025 finished at 4.1 million
units, the third consecutive flat year. Some pundits have described the housing market
as ‘frozen’. The good news? During the housing crisis of 2008-2011, EHS never fell
below 4.1 million unit sales and even if they dip slightly in 2026, a dip would likely be
just under 4 million units. And while about 85% of mortgages are at an interest rate
under 5% or less, there are still reasons why people move. From downsizing (often
when they own their home outright) to job or family changes to different housing
needs (new family creation is on the uptick) to job losses and a need to move, there
are myriad reasons why 4 million homes are sold every year.
What’s the Outlook for Interest Rates in 2026?
This is not an official forecast for interest rates; however, we offer some thoughts that are
pertinent to interest rates and hence, trucking volumes.
First, interest rate levels are a function of inflation expectations plus risk requirements. The 10-
year Treasury note is the bellwether for all interest rates and it reflects inflation expectations
plus a required premium for the risk of the issuer. The riskier the issuer then the higher the
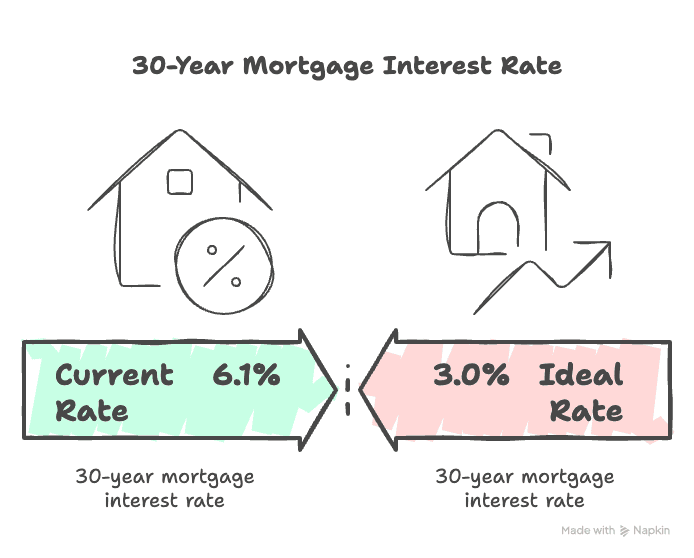
risk premium. Currently, the 10-year Treasury note yield is ~4.1%. Those yearning for 30-year
mortgage interest rates of 2.75% to 3.5% are likely to be disappointed for many years, if not
decades. The current 30-year mortgage is about 6.1% and while it may gradually fall towards
5.5%, it is unlikely to go much lower.
Median home prices nationally have advanced from ~$297,000 in 2020 to over $405,000 last
year. Near-zero interest rates as experienced in the aftermath of the housing crisis
(2009-2015) and during Covid (2020-mid-2022), while fun for buyers, actually have
contributed to the housing affordability problem. Housing costs as a percentage of
disposable income are about 43% (according to the Federal Reserve Board of Atlanta) and
consumer affordability typically peaks around 30% to 33%.
Wouldn’t It be Great if Interest Rates Were Near-Zero, Like in 2021 or 2009-2015?
It would be far better if interest rates come down gradually in 2026-2027 and to levels
nowhere near previous lows. Why? If interest rates fall too low (and too quickly), then
median prices will spike again (up 11% in 2021 and 19.9% in 2022), thereby exacerbating
affordability issues. Between 2008 and 2019 median home prices fell 3 times and were flat in
four other years. While not fun for those wishing to sell, moderating rates of increases in
median home prices will eventually create a healthier home ownership market for all
constituents, one where affordability is improved and the number of prospective buyers
increase for homes listed for sale.
So If Demand is Mixed and Mediocre, Then Will Trucking Supply Be the Story of
2026?
Since mid-2026, trucking headlines have been dominated by topics like ELP (English
Language Proficiency), non-domiciled CDLs, and the upcoming elimination of selfcertification
of CDL schools and instructors.
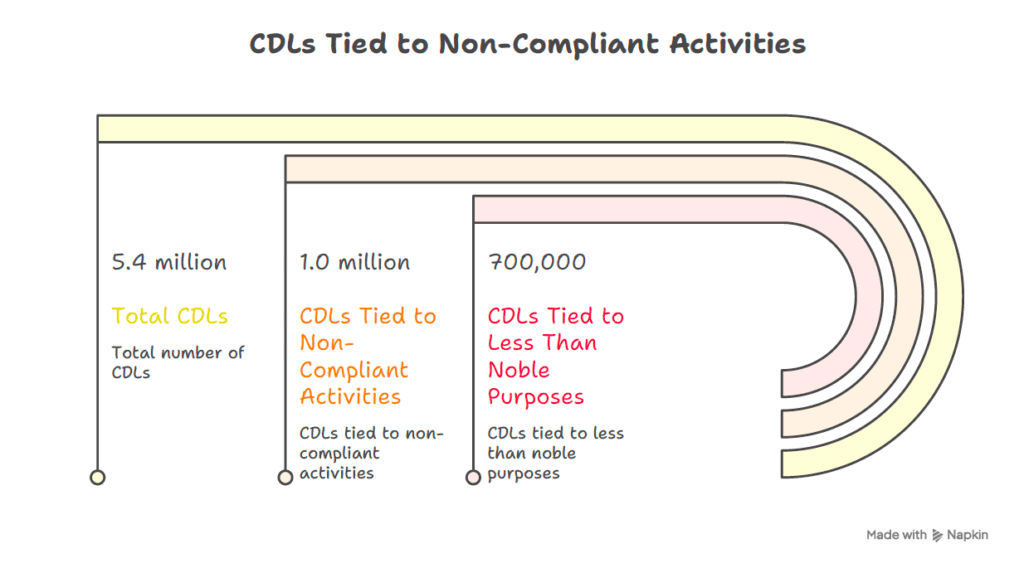
When looking at the number of interstate CDLs (3.8 million) and intrastate CDLs (1.6 million),
then 5.4 million CDLs exist. We have looked at CDLs from numerous issues, including all of
the headline topics of 2025 and early 2026. We have concluded that somewhere between
10% to 15% of CDLs are tied to DOT #s committed to either operating non-compliantly on a
consistent basis or to commit cargo theft and fraud…or both. Our estimates show that slightly
over 1.0 million CDLs may have been tied to such activities (even if the driver was not fully
aware). Due to weak freight rates, many drivers have left the industry, perhaps around
350,000, most tied to not making enough money. That leaves around 700K CDLs tied to less
than noble trucking purposes or about 13%. Even if that figure is high, it is not inconceivable
that at least 10% of CDLs are tied to operators not playing by the same rules as most of the
decent, hard working trucking companies and drivers in the industry.
What Do All of These Numbers and Trends Indicate for 2026-2027?
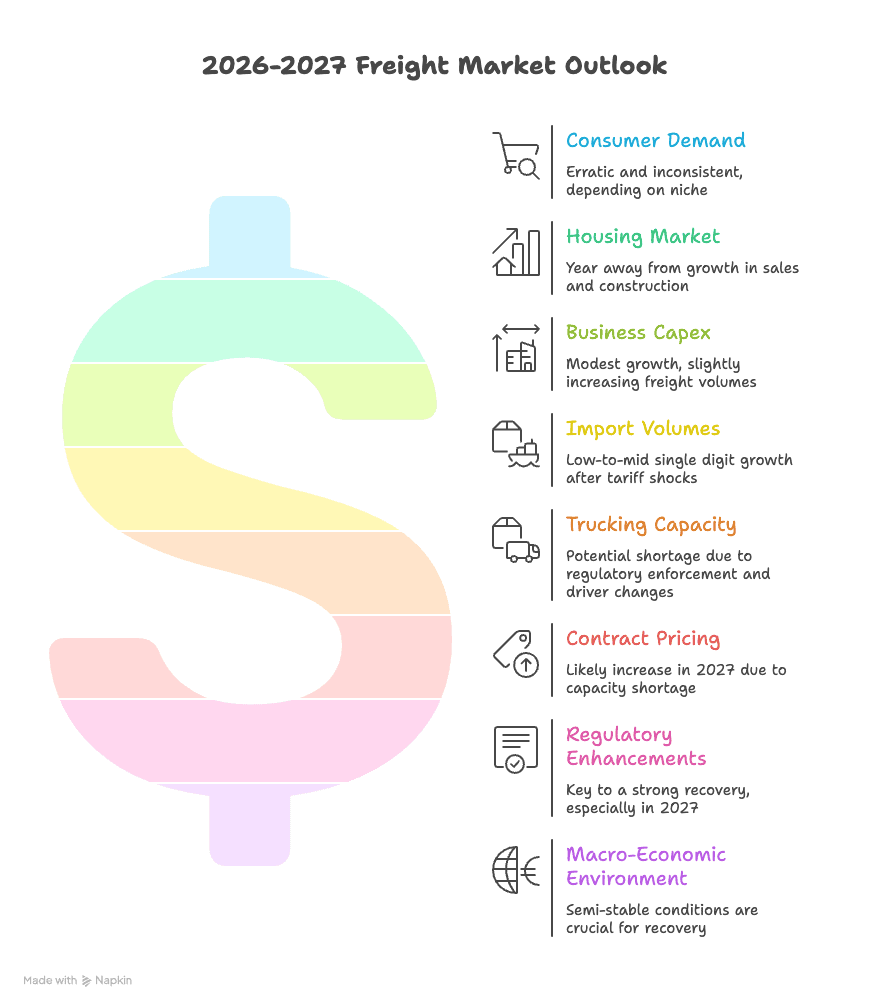
Consumer demand/spending and retail sales are likely to remain a bit erratic and
inconsistent, depending upon the business and consumer niche. Housing is probably a year
away from seeing growth in existing home sales and new housing construction starts. Yet,
business capex is likely to grow modestly in 2026, which would slightly increase freight
volumes. Import volumes, after the tariff shocks of 2025 and a 48% drop in Q2’25 and Q3’25,
are likely to see low-to-mid single digit growth throughout each 2026 quarter.
Entering 2H’2025 excess trucking capacity or supply was likely 2% or less. A 1% drop in
interstate trucking capacity would be about 38,000 drivers and between ELP and nondomiciled
CDLs, combined with other recently announced changes, along with others that
we anticipate, it is not inconceivable that 4% to 5% of industry capacity could be eliminated
before Labor Day, which would lead to a capacity shortage of 2% to 3%. That would likely
drive contract pricing up at least 7% to 8% in 2027 and if our estimates are too low, increases
could be double what we described. The keys, of course, are vigilant enforcement of
existing regulations, more practical insights tweaks to improve regulations by the FMCSA and
a semi-stable macro-economic environment.
If a trucking recovery is defined as growth in mileage utilization and at least modest price
increases, then 2026 should be a recovery year. If regulatory enhancements continue, it is
conceivable that 2027 could be a barn burner.
Thom Albrecht is the Chief Revenue Officer at Reliance Partners, an insurance agency
headquartered in Chattanooga, TN. Reliance works with about 10,000 motor carriers and
about 700 freight brokers. In his career, Mr. Albrecht was also the CFO of a Midwest
truckload carrier and before that, a transportation and logistics analyst on Wall Street for 28
years.